
Some time ago, I stumbled across a stunning video animating the European Air Traffic for 24 hours.
It it not only stunningly beautiful, it actually visualizes information that is not even present (as data) but made accessible by how we are looking at this video:
- The so called NATs (North Atlantic Tracks) the aircrafts are following on their eastbound course.
- The European Air Routes (the defined paths the aircrafts follow when flying from A to B)
- The SIDs (Standard Instrument Departures) and STARs (Standard Approach Routes) the aircrafts have to follow when taking off or landing at an airport – London Heathrow is a great example in this video.
Apparently, the film was produced by a company called 422 South. There are more such animations on their web page, so naturally, my question is “How the hell did they do that?” And “Can something like this (maybe a bit less professional!) be achieved with own data?”.
At the Google I/O 2013, a presentation named “All the Ships in the World” was shown which – in the sense of the traffic visualization – came close to what I am looking for – it can be found on Youtube as well.
Also, one year earlier, in 2012, at the Google I/O 2012, another presentation on visualization of geospatial data was given by Brendan Kenny which also contains some really interesting elements.
So one of the early answers I found was that looking into existing technologies would be much more promising than trying to do something stupid on my own. The next question was “Where do I get some code examples from?” – as you watch the videos I have linked to so far, you can see that there is little to no code shown. Which means I know something can be done but I do not know how it is done 🙁
So I started digging a bit and came across a more “development-centric” tutorial which now revealed some of the insides of the code. The series is called “A Journey of 245k Points” and is made up of two parts – Part 1 and Part 2. These are a little bit harder to listen to but gives a significant depth of how things can be done…
Setting the Scene
One of the reasons I am doing all this is my affinity to aircrafts and specifically to information about the German Luftwaffe from 1935 – 1945. You can find more about what I am doing there on my website at www.chronicles-of-the-luftwaffe.de but for now, let’s just say I have a large number of flight logs from former Luftwaffe pilots and there is tons of data in there.
Specifically, there are two types of information that are almost predestined for geographic data visualization: the airfields and the flights. Let’s work with the Flight Log of Walter Stolz (which I have discussed in detail here). It makes it nice and easy to work as an example because you can have all the historical details already lined out before you.
Looking at the first page of his log, a few airports already are mentioned:
- Riem (which is Munich/Riem) at the coordinates 48°07’55″N and 11°42’00″E (48.131944, 11.7)
- Gablingen at the coordinates 48°27’00″N and 10°51’50″E (48.45, 10.8638889), and
- Lechfeld at the coordinates 48°11’20″N and 10°51’40″E (48.1888889, 10.8611111)
The coordinates have been provided by Jürgen Zapf (see www.flugplaetze-der-luftwaffe.de)
My first Map
So my first map will be a simple and easy one – I will just try and come up with a map that showing the region between Augsburg, Munich and the Alps in a first go. The area of southern Germany these three airports are located in.
Most of the code is from developers.google.com – if you want to download my copy, click here. Let’s take a look…
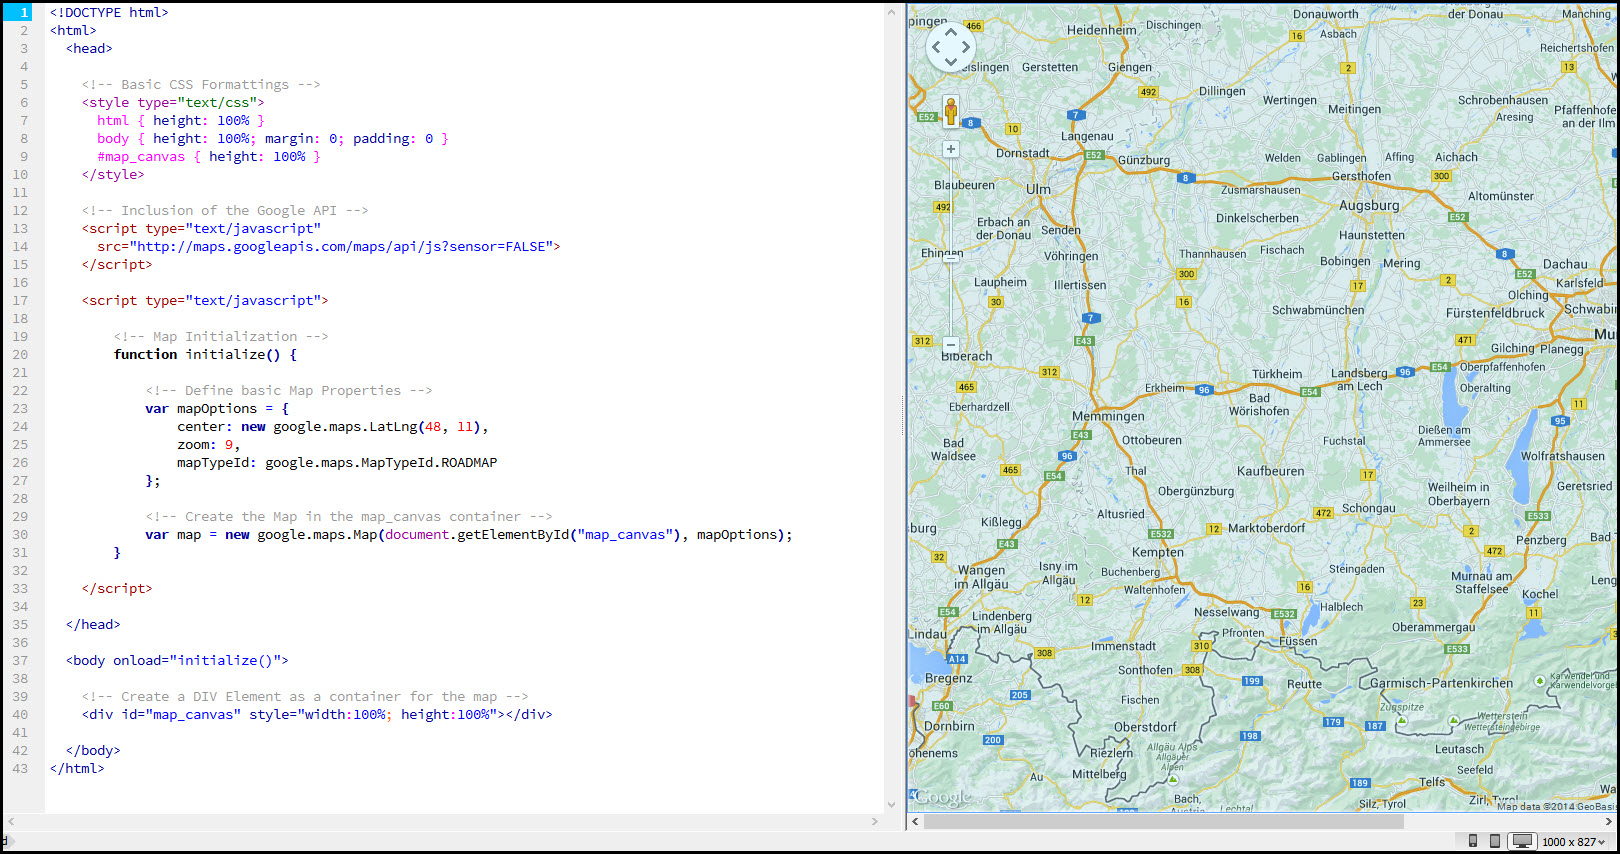 The code is written using DreamWeaver – that’s where the screenshot is from. It is relatively straight forward, an HTML5 document with some inline CSS for the <html> and <body> elements as well as for any element that has a “map_canvas” id.
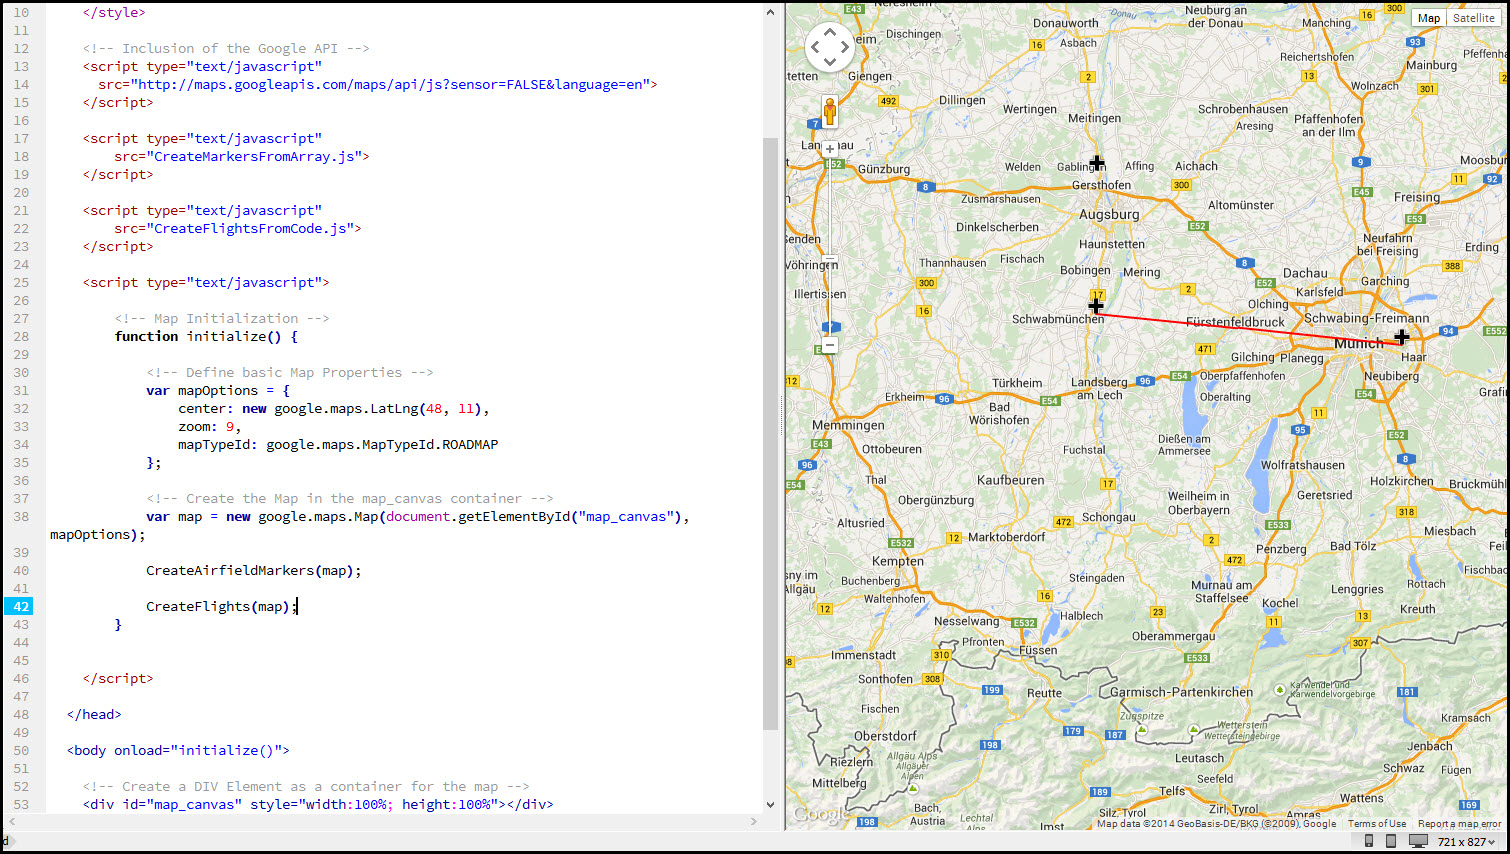
Next, a reference to the Google Maps API, followed by an inline implementation of the Initialize() function. This function is called when the <body> element is loaded and creates a Map object associated with the <DIV> element in the body.
Pretty cool – that already gives us a map from Google that can be zoomed, dragged, and managed in any way Google Maps itself allows us to manipulate a map.
Adding the Airfield Markers
The Airfield Markers are presenting a little issue for me – not so much because I would not know how to place a marker, no: it is more the fact that there will be a large number of markers and that their creation will differ over time.
A first thought was to store them in an XML File and read them from there – a good summary of what that involves can be found here. The problem: channeling the reading of the XML File through the XMLHttpRequest requires me to host my sample files in a web server (otherwise, HTTP goes into nirvana and nothing is displayed…)
My system is running a local instance of Internet Information Server anyway so it is not a real issue… but it is not what I want to do at the moment. The screenshot below shows the working routine with the XMLHttpRequest approach.
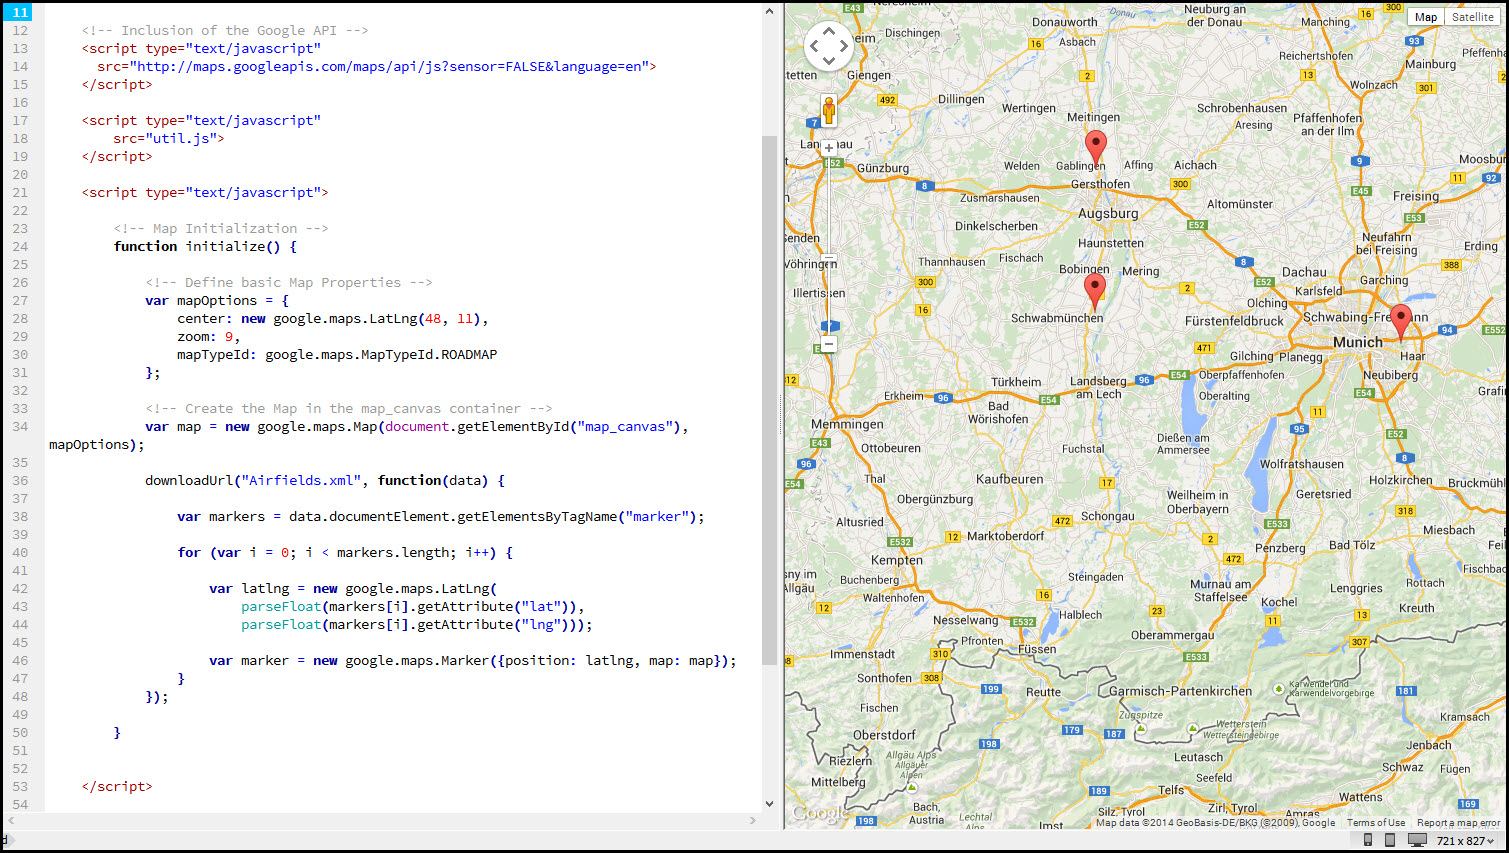 Note the extra <script> element near the top? This includes util.js which contains the downloadURL() function and associated helper routines. The downloadURL() call including its in-line call-back function can be found towards the bottom of the initialize() function.
The page is served via Internet Information Server and the markers display just fine. So now let’s rip it apart again…
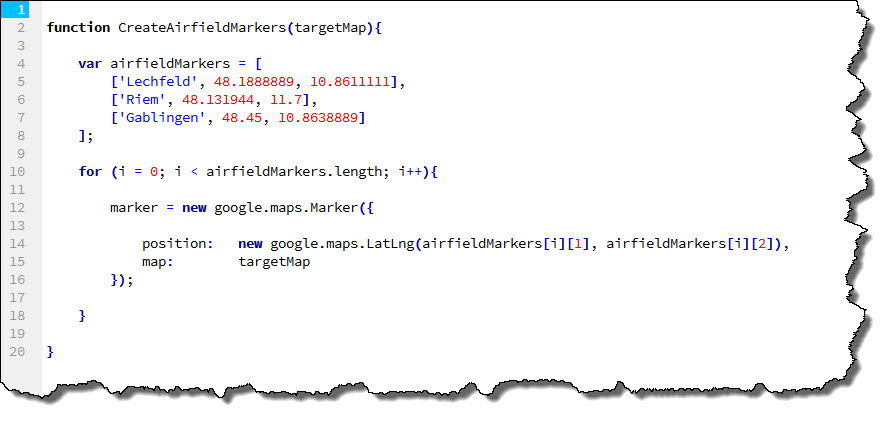
First of all, I have created a new file named CreateMarkersFromArray.js – this servers as an external Java-Script file and holds one single function called CreateAirfieldMarkers. This function takes one argument targetMap which represents the map object to place the markers on. The screenshot below shows the new code within the HTML Page.
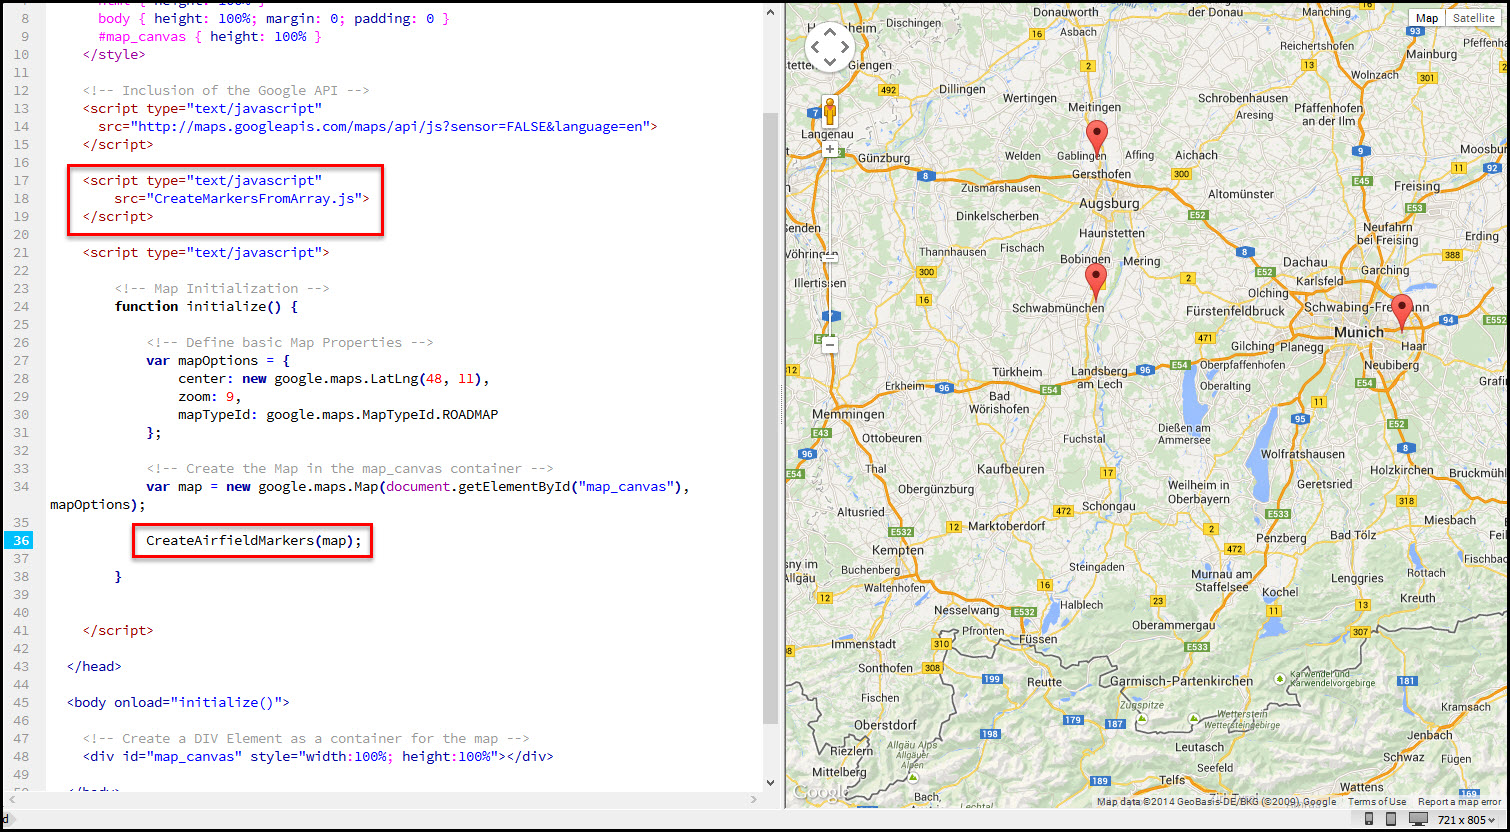 Marked are the inclusion of the external Java-Script file and the call to the CreateAirfieldMarkers function which looks like this:
 I finally also decided to replace the standard Marker Icon with my own, more Luftwaffe-specific icon… the change is simple, just add the reference to the respective icon to the constructor of the Marker.
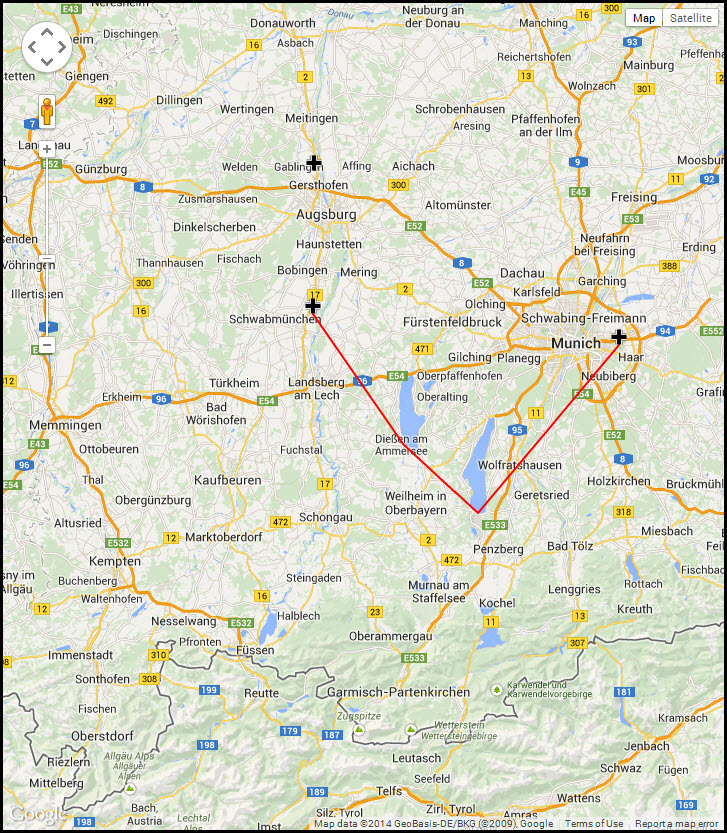
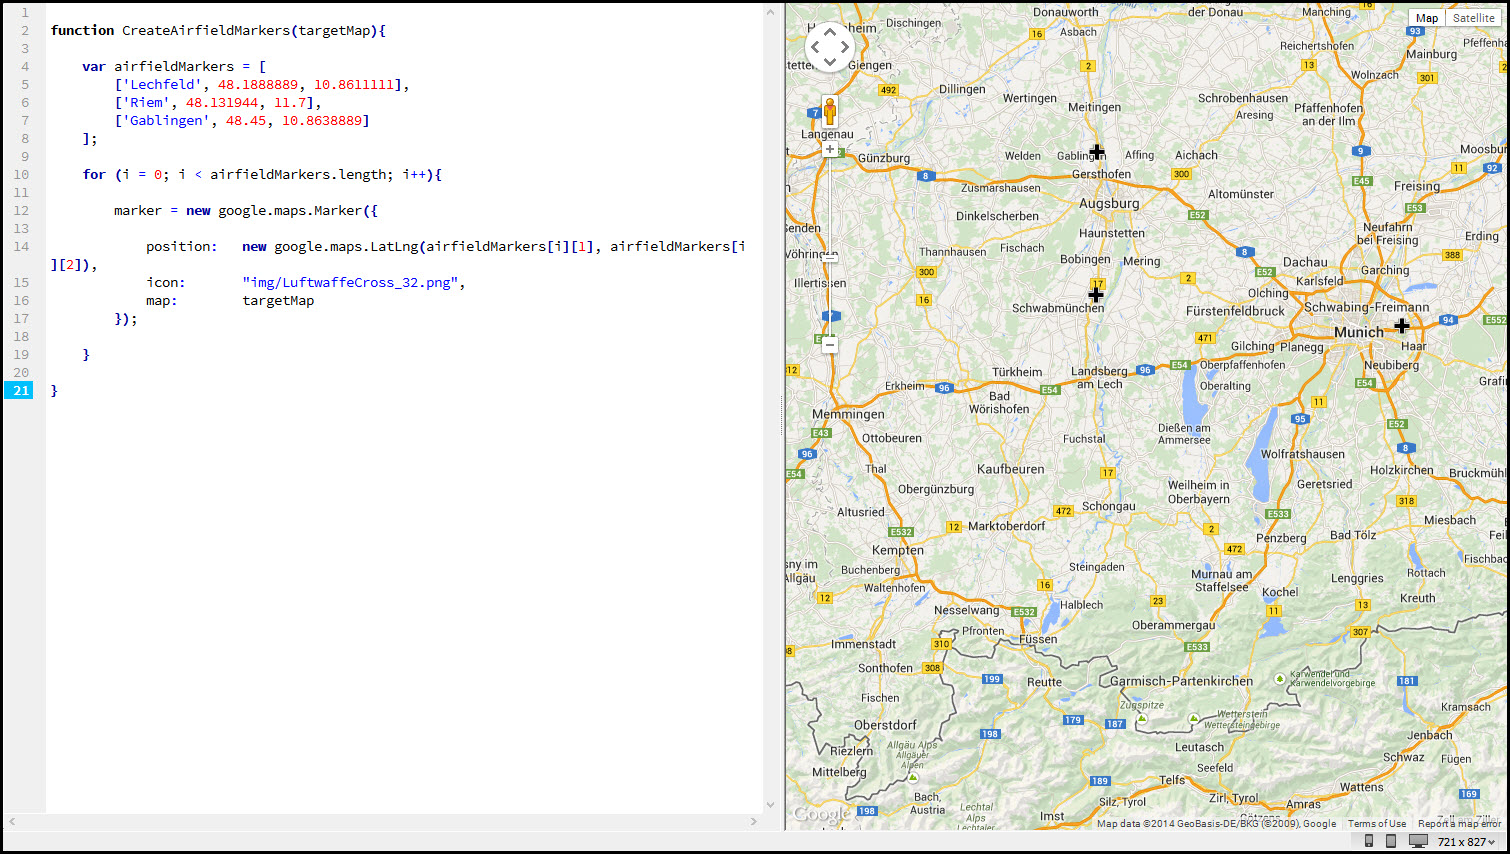 So now we got the three airfields that Walter Stolz was using on his first flights – which is the next piece of information I would like to add to the map.
Adding an (imaginary) Flight
Let’s add an imaginary flight first – imaginary because it is not a flight in Walter Stolz’s flight log because I need a flight to go from one airfield to another one (rather than taking off and landing on the same airfield).
For now, I have settled for a flight from Munich-Riem to Lechfeld – again, the definition of the flight is placed in an external Java Script file for easier manipulation.
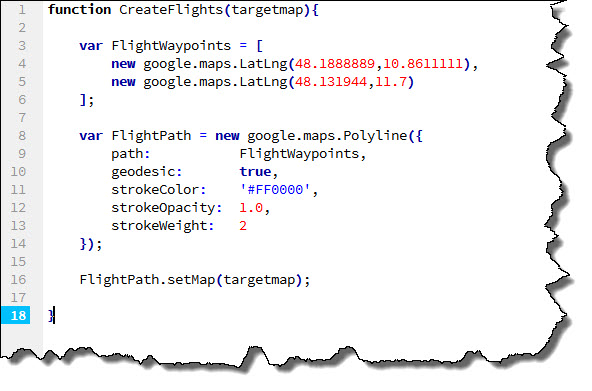 I also adjusted my HTML Code, including the new Java Script file and adding a call to the CreateFlights function. Currently, the flight simply shows up as a single red line connecting the two airfield markers.
 But flights are rarely straight flights from A to B – which is why I have chosen the Polyline as basis for my flight path. Let’s just assume (imaginary flight, remember?) that Walter Stolz did not fly directly from Munich to Lechfeld, let’s say they did a trip, leaving Munich to the south-west, towards the southern tip of Lake Starnberg. Then, heading over west to the city of Schongau and then to the airfield at Lechfeld.
All that needs to be done is adding the new waypoints to the flight path (formed by the Polyline).
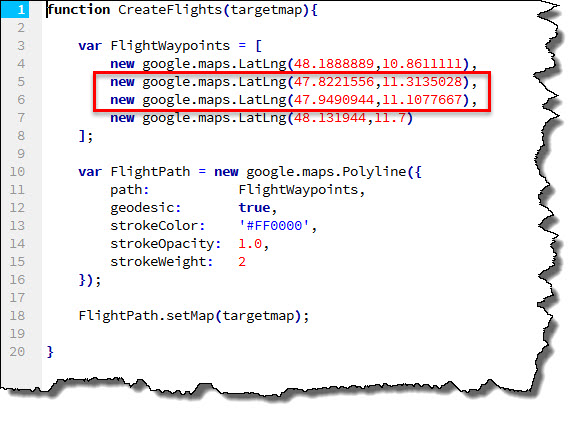 Once the map is redrawn, the flights now looks more like a scenic flight…
 So far, so good. What has been achieved so far?
- We can create a map based upon the Google Maps API
- We know how to create Markers (our airfields) and display custom Marker Icons (our Luftwaffe crosses)
- We can also add a flight from one airfield to another one by adding a Polyline to the map.
And what are the next steps for the days to come?
- We need to find a way to show a flight departing and arriving at the same airfield when we do not have any additional waypoints.
- We need to find a way to add more information to the flight such as Date, Time, Aircraft flown, etc.
- We need to find a way to add multiple flights – from the same pilot (sequential) and other pilots (parallel).
- We need to find a way to animate these flights – preferably using a slider control first that fades in flights as time progresses.
Is that anywhere close to the video I have referred to at the top? No – but we already have a chance to visualize geospatial data and make it “accessible”.